
What is Root Cause Analysis (RCA)?
Root Cause Analysis (RCA) is an organized method for identifying the fundamental or deep-rooted cause of a problem or failure, instead of just addressing its immediate surface-level symptoms.
Why is Root Cause Analysis Important?
Cost Reduction: Preparing a systematic RCA report results in significant cost savings by identifying and eliminating recurring problems. This approach serves as a permanent solution that helps reduce costs spent on temporary fixes.
Improved Decision-Making: RCA provides evidence-based insights and recommendations, helping company leaders make more informed strategic decisions.
Enhanced Customer Satisfaction: Resolving underlying causes of service or product issues enables companies to deliver a reliable and satisfying customer experience.
Operational Efficiency: When root causes are properly addressed, teams can spend less time resolving issues and more time focusing on other main activities.
Risk Mitigation: RCA helps organizations identify and address systemic vulnerabilities before they escalate into major crises.
Knowledge Building: Participating in the RCA process provides valuable learning and strengthens problem-solving capabilities.
Competitive Advantage: Organizations that follow the root cause analysis technique can adapt more quickly to market changes and operate more efficiently than other competitors in the industry.
Common RCA Techniques
Real-World Example: Travel and Tour Website
Case Study: Online Travel Booking System Failures
Background:
A popular online travel booking platform experienced frequent system crashes during peak booking periods, resulting in loss and customer frustration. The platform handled hotel reservations, flight bookings, and tour packages for over 100,000 daily users.
Given below are the RCA techniques and processes that can be followed to resolve the above given scenario,
5 Whys
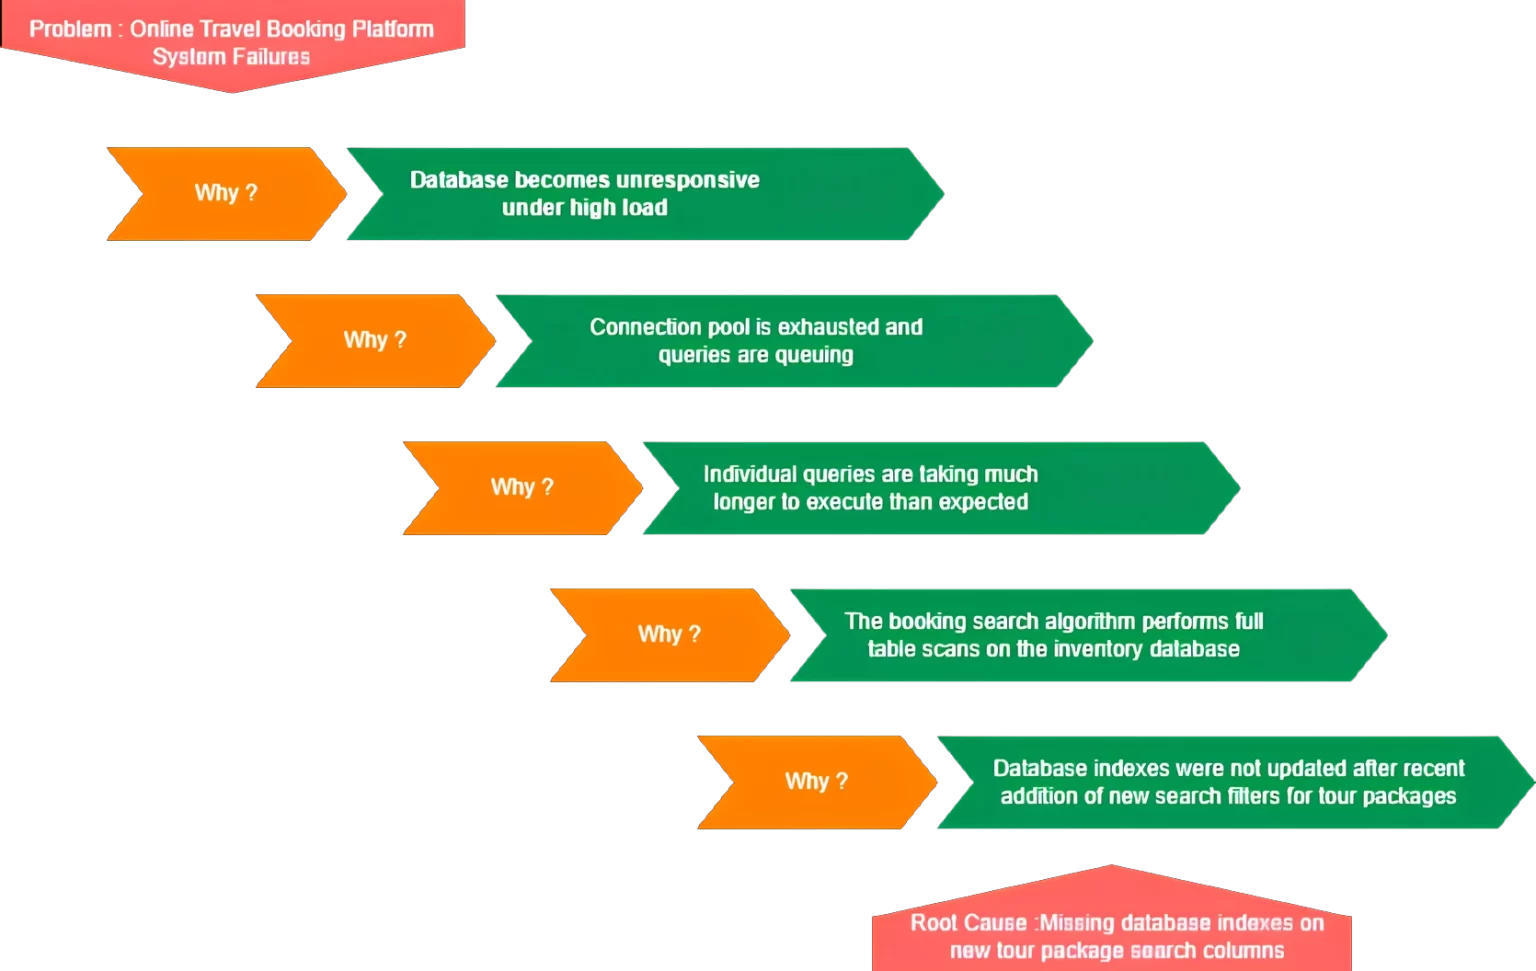
The 5 Whys technique involves asking the question – “Why?” repeatedly for each surface-level symptom until the fundamental root cause is revealed. This is a simple and effective technique for resolving company problems.
Example Process
Problem:
An Online Travel Booking Platform System Crashes during peak periods
Why #1
Why does the system crash during peak periods? → Database becomes unresponsive under high load.
Why #2
Why does the database become unresponsive? → Connection pool is exhausted, and queries are queuing up.
Why #3
Why are connections exhausted? → Individual queries are taking much longer than expected to execute.
Why #4
Why are queries taking longer? → The booking search algorithm performs full table scans on the inventory database.
Why #5
Why are full table scans happening? → Database indexes were not updated after the recent addition of new search filters for tour packages.
Root Cause:
Missing database indexes on new tour package search columns
Fishbone Diagram (Ishikawa Diagram)
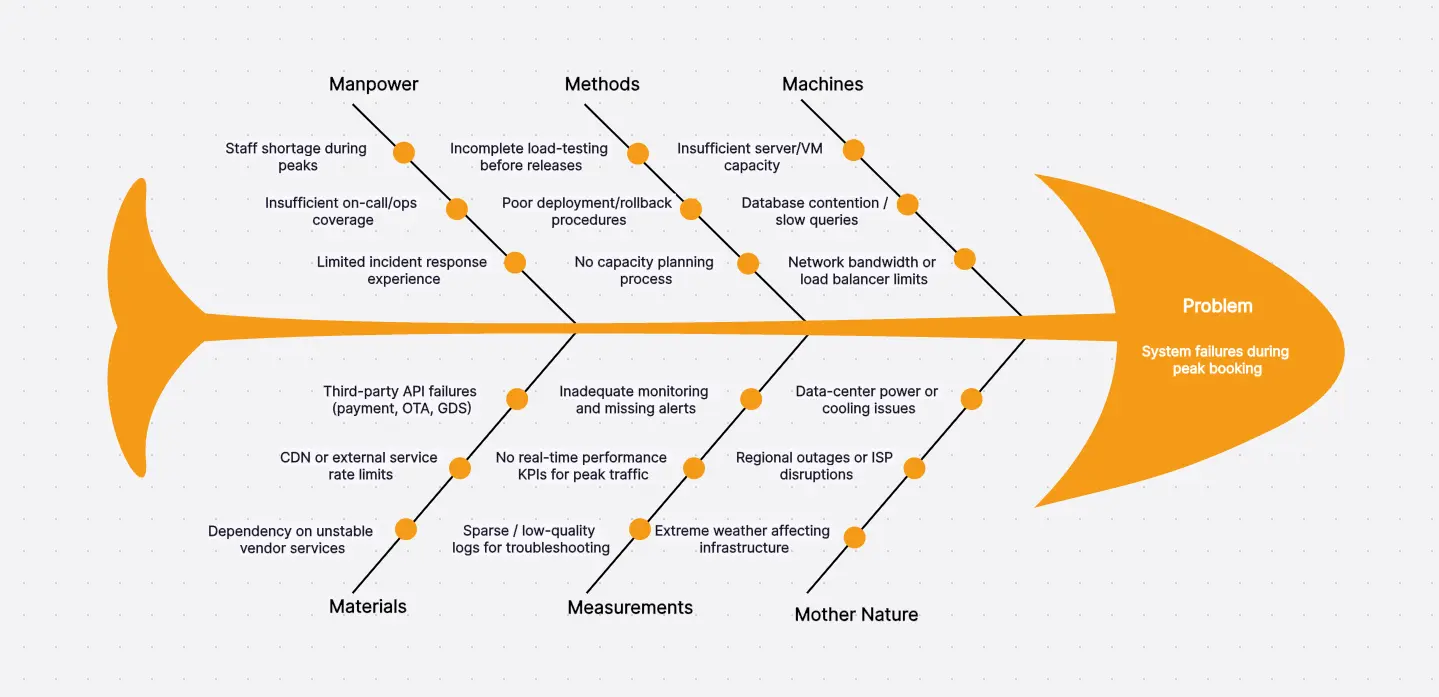
The Fishbone Diagram is a visual method of presenting the root cause analysis by sorting the potential causes of an issue into categories. This technique provides a full overview of all the possible contributing factors for the issue.
Standard Categories (6 M’s)
Manpower: People-related factors (staff, experience, skills, training).
Methods: Process and procedure issues.
Machines: Equipment, hardware, software, technology, and tool issues.
Materials: Raw materials, input quality, availability, or specifications.
Measurements: Data accuracy, KPI metrics, and performance monitoring techniques
Mother Nature: Environmental factors and external conditions.
This technique is ideal for complex problems with multiple potential contributing factors.
Pareto Analysis
The Pareto Analysis Technique follows the 80/20 principle, in which teams focus on prioritizing and addressing a small number of critical issues out of all the other contributing causes of a problem. This approach in turn, helps the company achieve an overall greater improvement while avoiding unnecessary time spent on resolving the least impactful issues.
Process
- Make a list of all the potential causes for the problem
- Assign a frequency (how often it occurs) for each cause based on its impact on the problem
- Arrange the causes in decreasing order, from most frequent to least frequent
- Using Create a Pareto chart showing cumulative impact
- Focus prioritizing on the top 20% of causes that drive 80% of the problem
Fault Tree Analysis
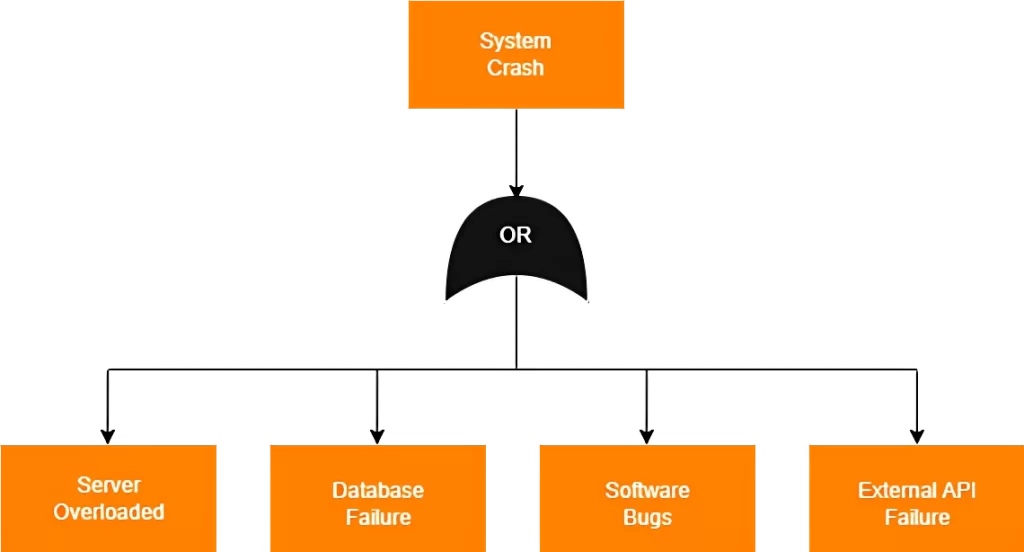
Fault Tree Analysis is a top-down approach to identify all the possible combinations of failures that lead to the cause of a specific undesired event. This technique is ideal for preventing major failures in complex systems.
A logical tree structure consisting of the following components is created to complete this analysis,
- Top Event: The problem being analyzed
- Logic Gates: Boolean operator to show the relationship between the events
- Intermediate Events: Contributing factors that lead to the top event
- Basic Events: Fundamental failures that cannot be broken down further
In conclusion, applying Root Cause Analysis (RCA) techniques provides organizations a structured and modern approach to identifying and addressing the underlying causes of failures. In turn, this benefits the organization by reducing recurring problems and achieving long-term improvements.